Psychedelic Neuroplasticity & Pancreatic Cancer
Psychedelic Neuroplasticity and the Perineural Microenvironment of Pancreatic Cancer
The Convergence
TrkA and TrkB are, structurally, nearly the same protein. They’re encoded by different genes — NTRK1 and NTRK2 — but their kinase domains fold almost identically: an AlphaFold-based structural alignment of the two domains returns a TM-score of 0.97 and 77% sequence identity. (For context: a TM-score above 0.5 generally means “same fold family”; 0.97 is close to the ceiling, these are near-identical machines.) Functionally, both receptors, once activated, fire the same downstream cascades: MAPK/ERK, PI3K/Akt, and PLCγ.
Where they normally differ is context. TrkA, activated by nerve growth factor (NGF), is the receptor pancreatic ductal adenocarcinoma (PDAC) hijacks to drive perineural invasion (PNI), tumor cells growing along and into nerves, a near-universal feature of PDAC and a major reason the disease is so difficult to treat. TrkB, normally activated by BDNF, is a receptor associated almost exclusively with the central nervous system, which is what makes a 2023 finding from Moliner and colleagues so striking: psilocin, the active metabolite of psilocybin, directly binds TrkB as a positive allosteric modulator, and that direct binding appears to be a primary driver of the neuroplasticity behind psychedelic therapy’s effects.
Current Progress
As of mid-2026, both of Compass Pathways’ pivotal Phase 3 trials of COMP360 psilocybin for treatment resistant depression (COMP005 and COMP006) have met their primary endpoints, with a durable benefit reported through at least six months and a generally well tolerated safety profile. An FDA filing is targeted for Q4 2026. Clinical trials testing psilocybin assisted therapy for cancer-related psychological distress have existed for close to a decade already; a regulatory approval for psilocybin in any indication makes it dramatically more likely that patients carrying both a depression diagnosis and a PDAC diagnosis will be offered, or will seek out, this treatment.
Computational Validation: TCGA-PAAD Analysis
To ground the structural argument in real tumor biology, I analyzed NTRK1 (TrkA) and NTRK2 (TrkB) expression across the TCGA-PAAD cohort (n = 182 PDAC tumor samples with matched expression and survival data).
Expression of NTRK1 and NTRK2 in PDAC
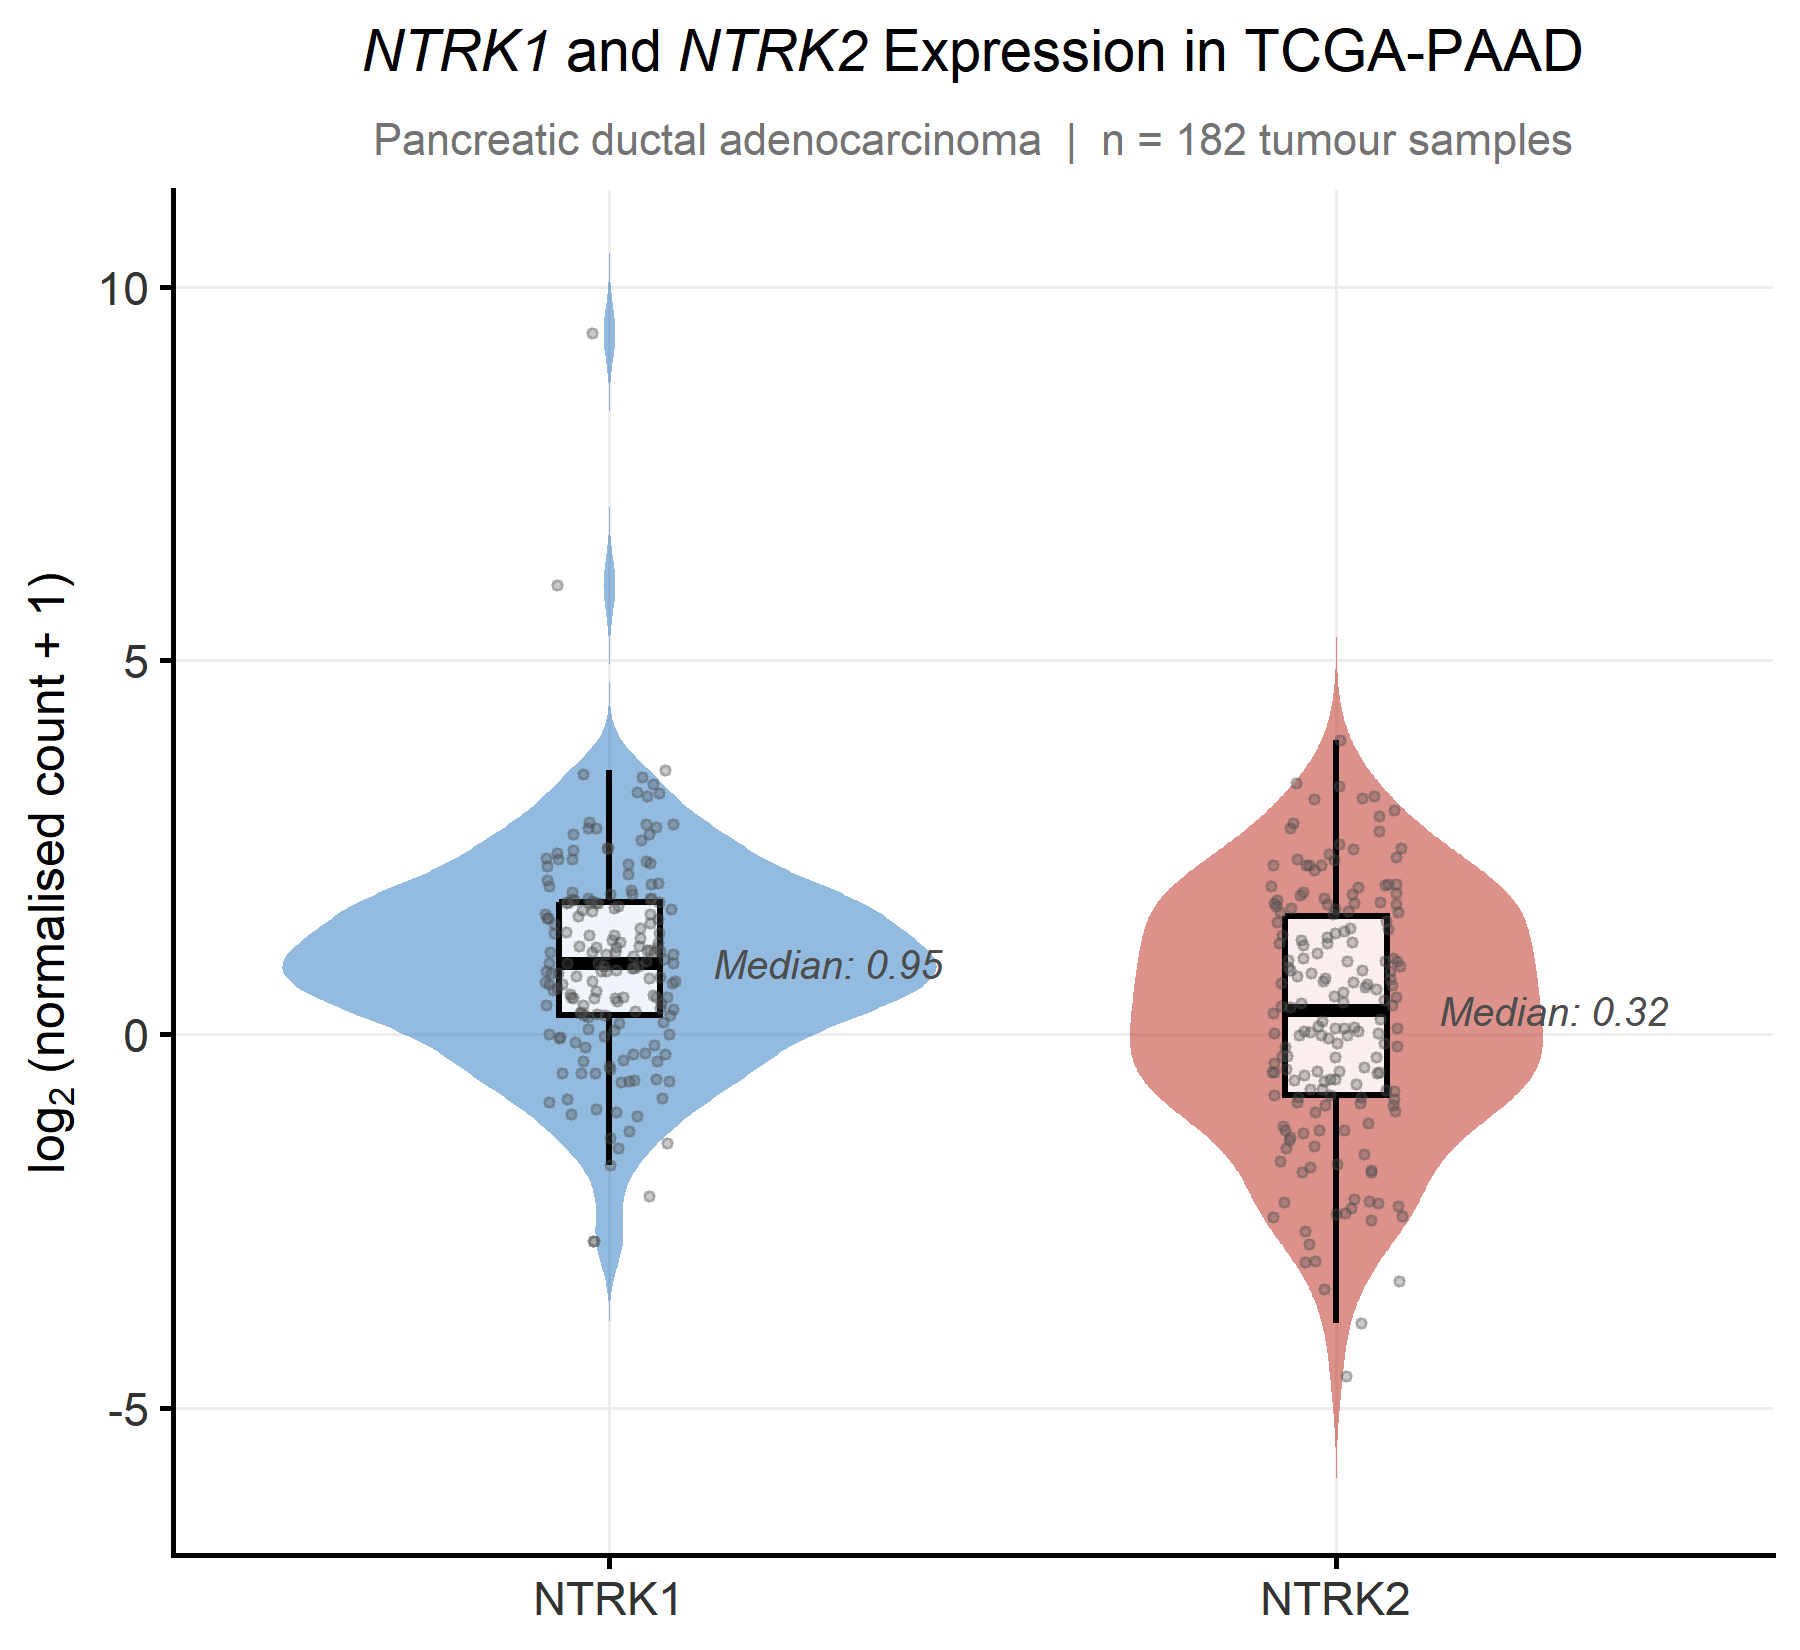
Both receptors are detectable across the cohort, but NTRK1 is expressed substantially higher and more variably (median log₂ = 0.95) than NTRK2 (median log₂ = 0.32), with a right skewed tail of high-TrkA outlier tumors, consistent with TrkA’s established, active role in driving perineural invasion in a subset of aggressive tumors.
NTRK2 is the more interesting number precisely because it’s lower. TrkB is not a gene you’d expect to see much of outside brain tissue at all, finding it reliably expressed in a solid pancreatic tumor sample is itself worth pausing on, and it’s the first hint that what’s being measured here isn’t purely “tumor cell biology.” It’s a clue picked up again in the next section.
Co-expression — and the confound that almost explained it away
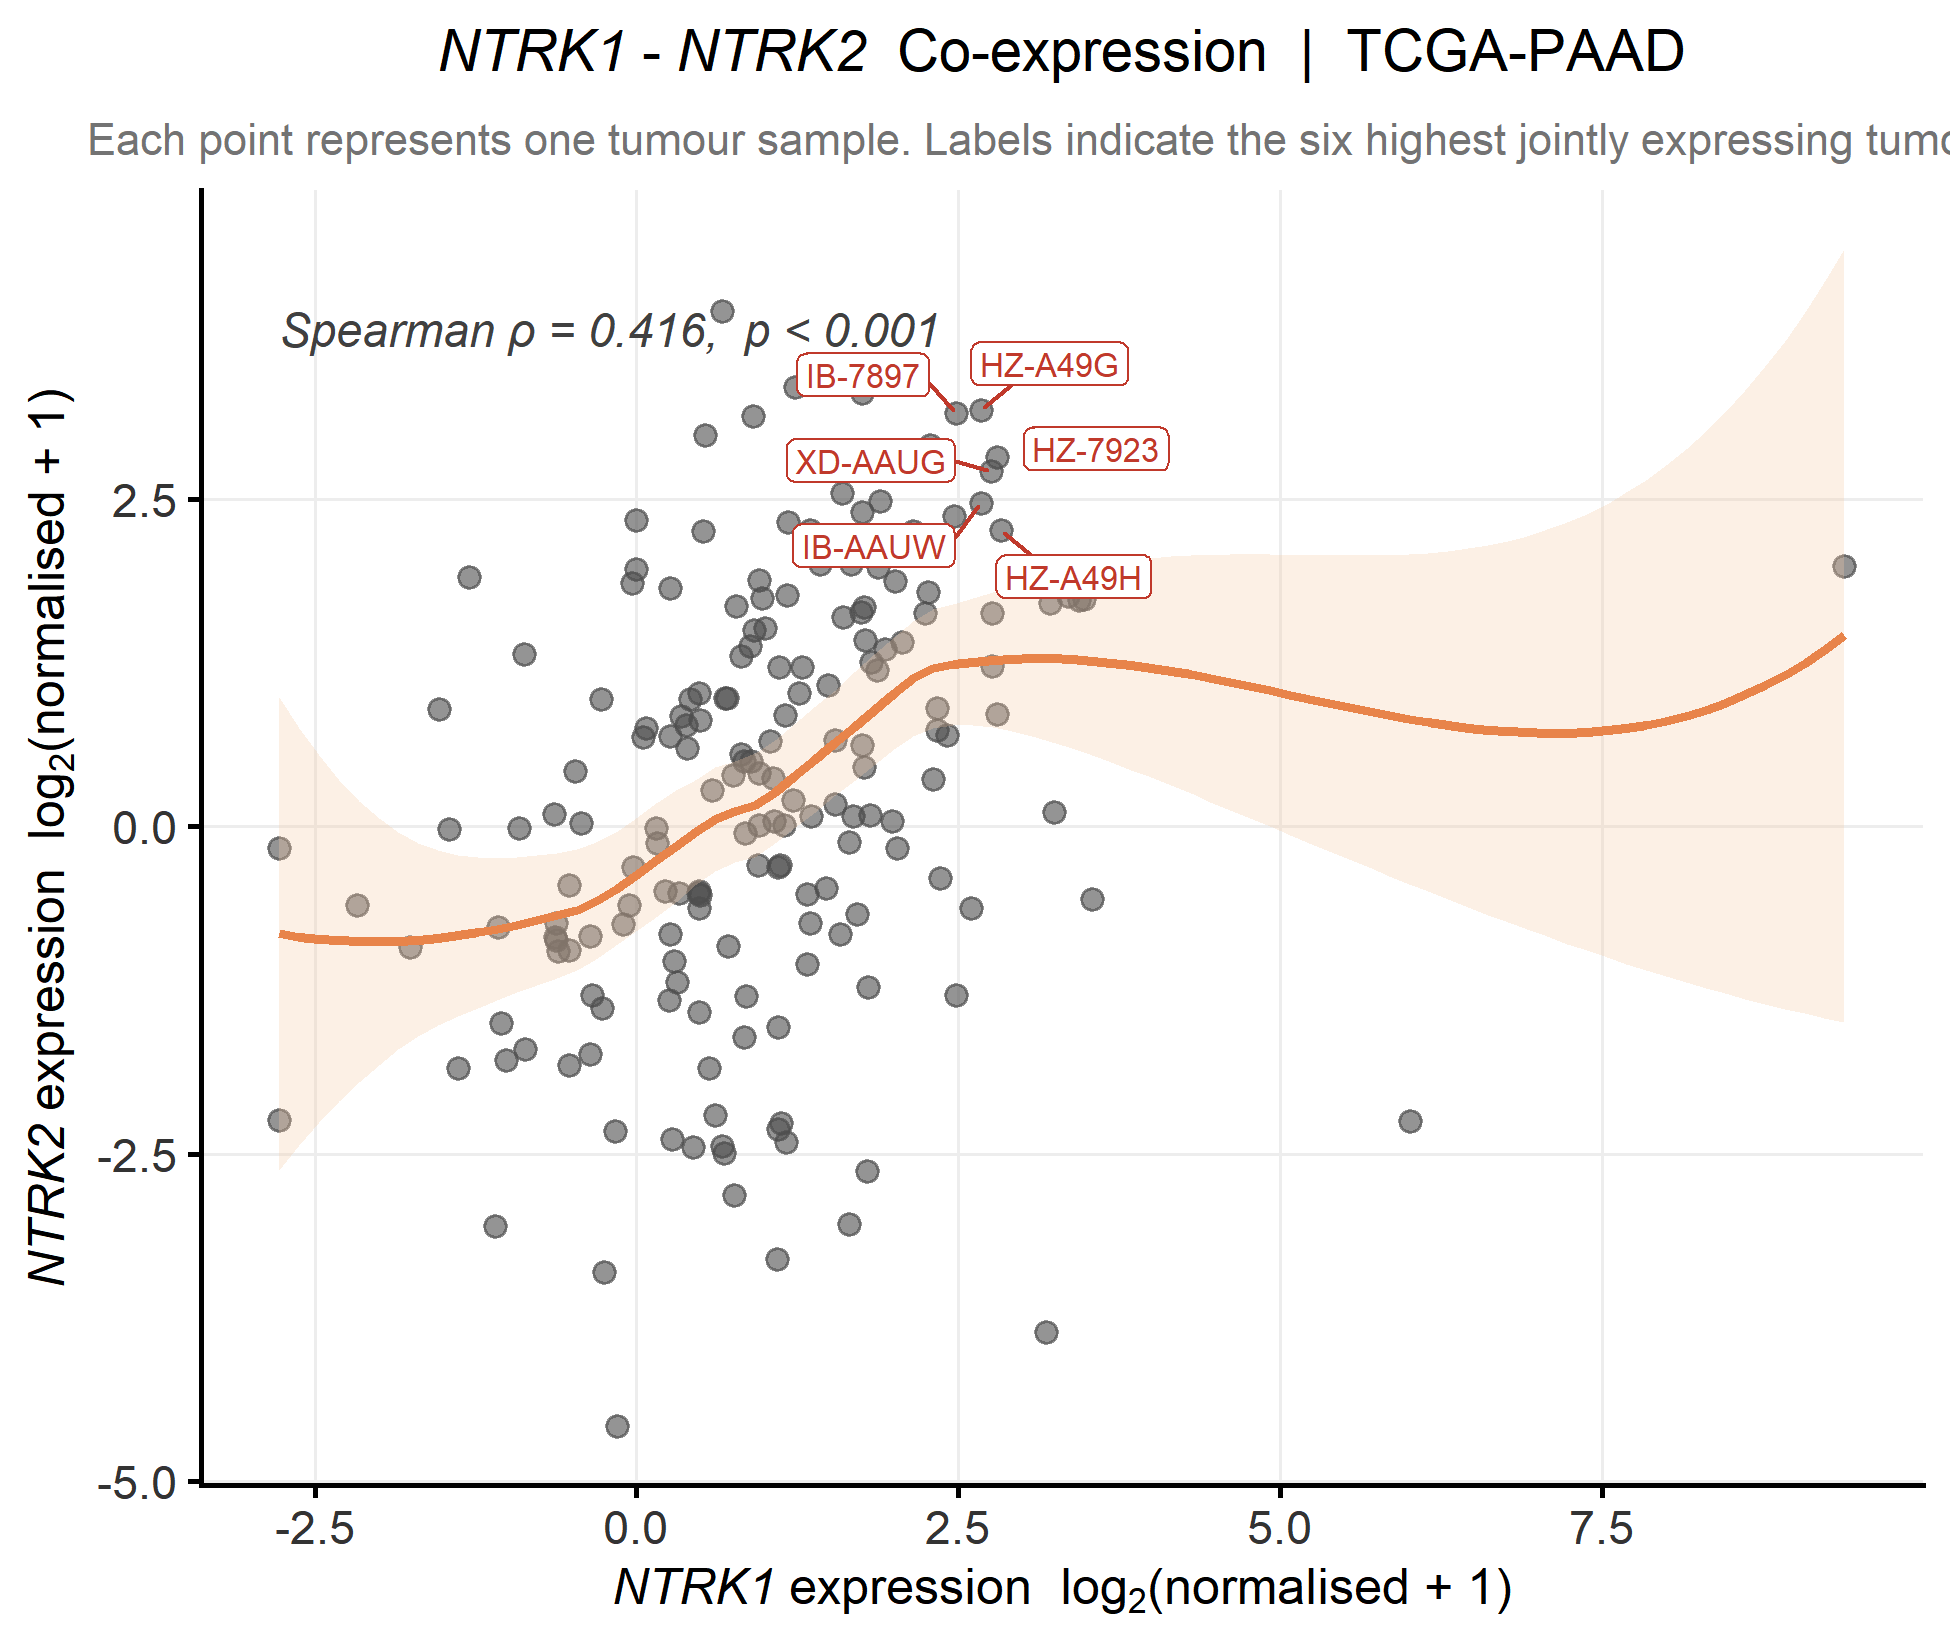
NTRK1 and NTRK2 are moderately, significantly co-expressed within the same tumors, on its own, a plausible hint of shared regulation. But bulk tumor sequencing has a known blind spot, a “tumor sample” isn’t pure tumor cells. It’s whatever the biopsy needle picked up, tumor, stroma, immune infiltrate, and, in a perineurally invasive cancer specifically, nerve tissue. If a sample simply contains more nerve tissue, it will show more of both neurotrophin receptors, whether or not the tumor cells themselves are doing anything coordinated at all.
So both receptors were checked against ESTIMATE-derived tumor purity — and both correlate negatively with it (NTRK1: ρ = -0.55; NTRK2: ρ = -0.43; both p < 10⁻⁸), meaning less-pure, more stroma/nerve-rich tumors do carry more of both receptors, exactly as the confound predicts. The test that matters is what’s left after removing that effect: the partial correlation between NTRK1 and NTRK2, controlling for purity, is still significant (partial ρ = 0.245, p = 0.001). Some of the original correlation was, in fact, just “more nerve tissue in the sample,” but not all of it.
Survival Analysis
Neither gene showed a statistically significant association with overall survival at median-split dichotomization. A stage-adjusted, continuous Cox model for NTRK2 showed a similar non-significant trend (per-unit HR = 0.92, 95% CI 0.81–1.0, p = 0.166).
This null result stated plainly, at n = 182, this cohort is underpowered to detect a moderate gene-level survival effect, and PDAC’s prognosis is grim enough across nearly every molecular subtype that a single receptor pair was never likely to move the needle much on its own. What the survival analysis rules out is a simple, strong, linear “more receptor, worse outcome” story.
Pathway Enrichment
Ranking every gene in the genome by its correlation with NTRK2 expression surfaced a coherent pattern. Tumors with higher NTRK2 showed enrichment for neuroactive ligand signaling, cell adhesion, pancreatic secretion, and hematopoietic lineage pathways, and in the opposite direction, depletion of core proliferation machinery, the proteasome, ribosome, cell cycle, and DNA replication/repair pathways. Put together, that reads as: tumors with more NTRK2 signal look less proliferative and more differentiated, or more accurately, more neurally, and microenvironment associated, which fits the interpretation above.
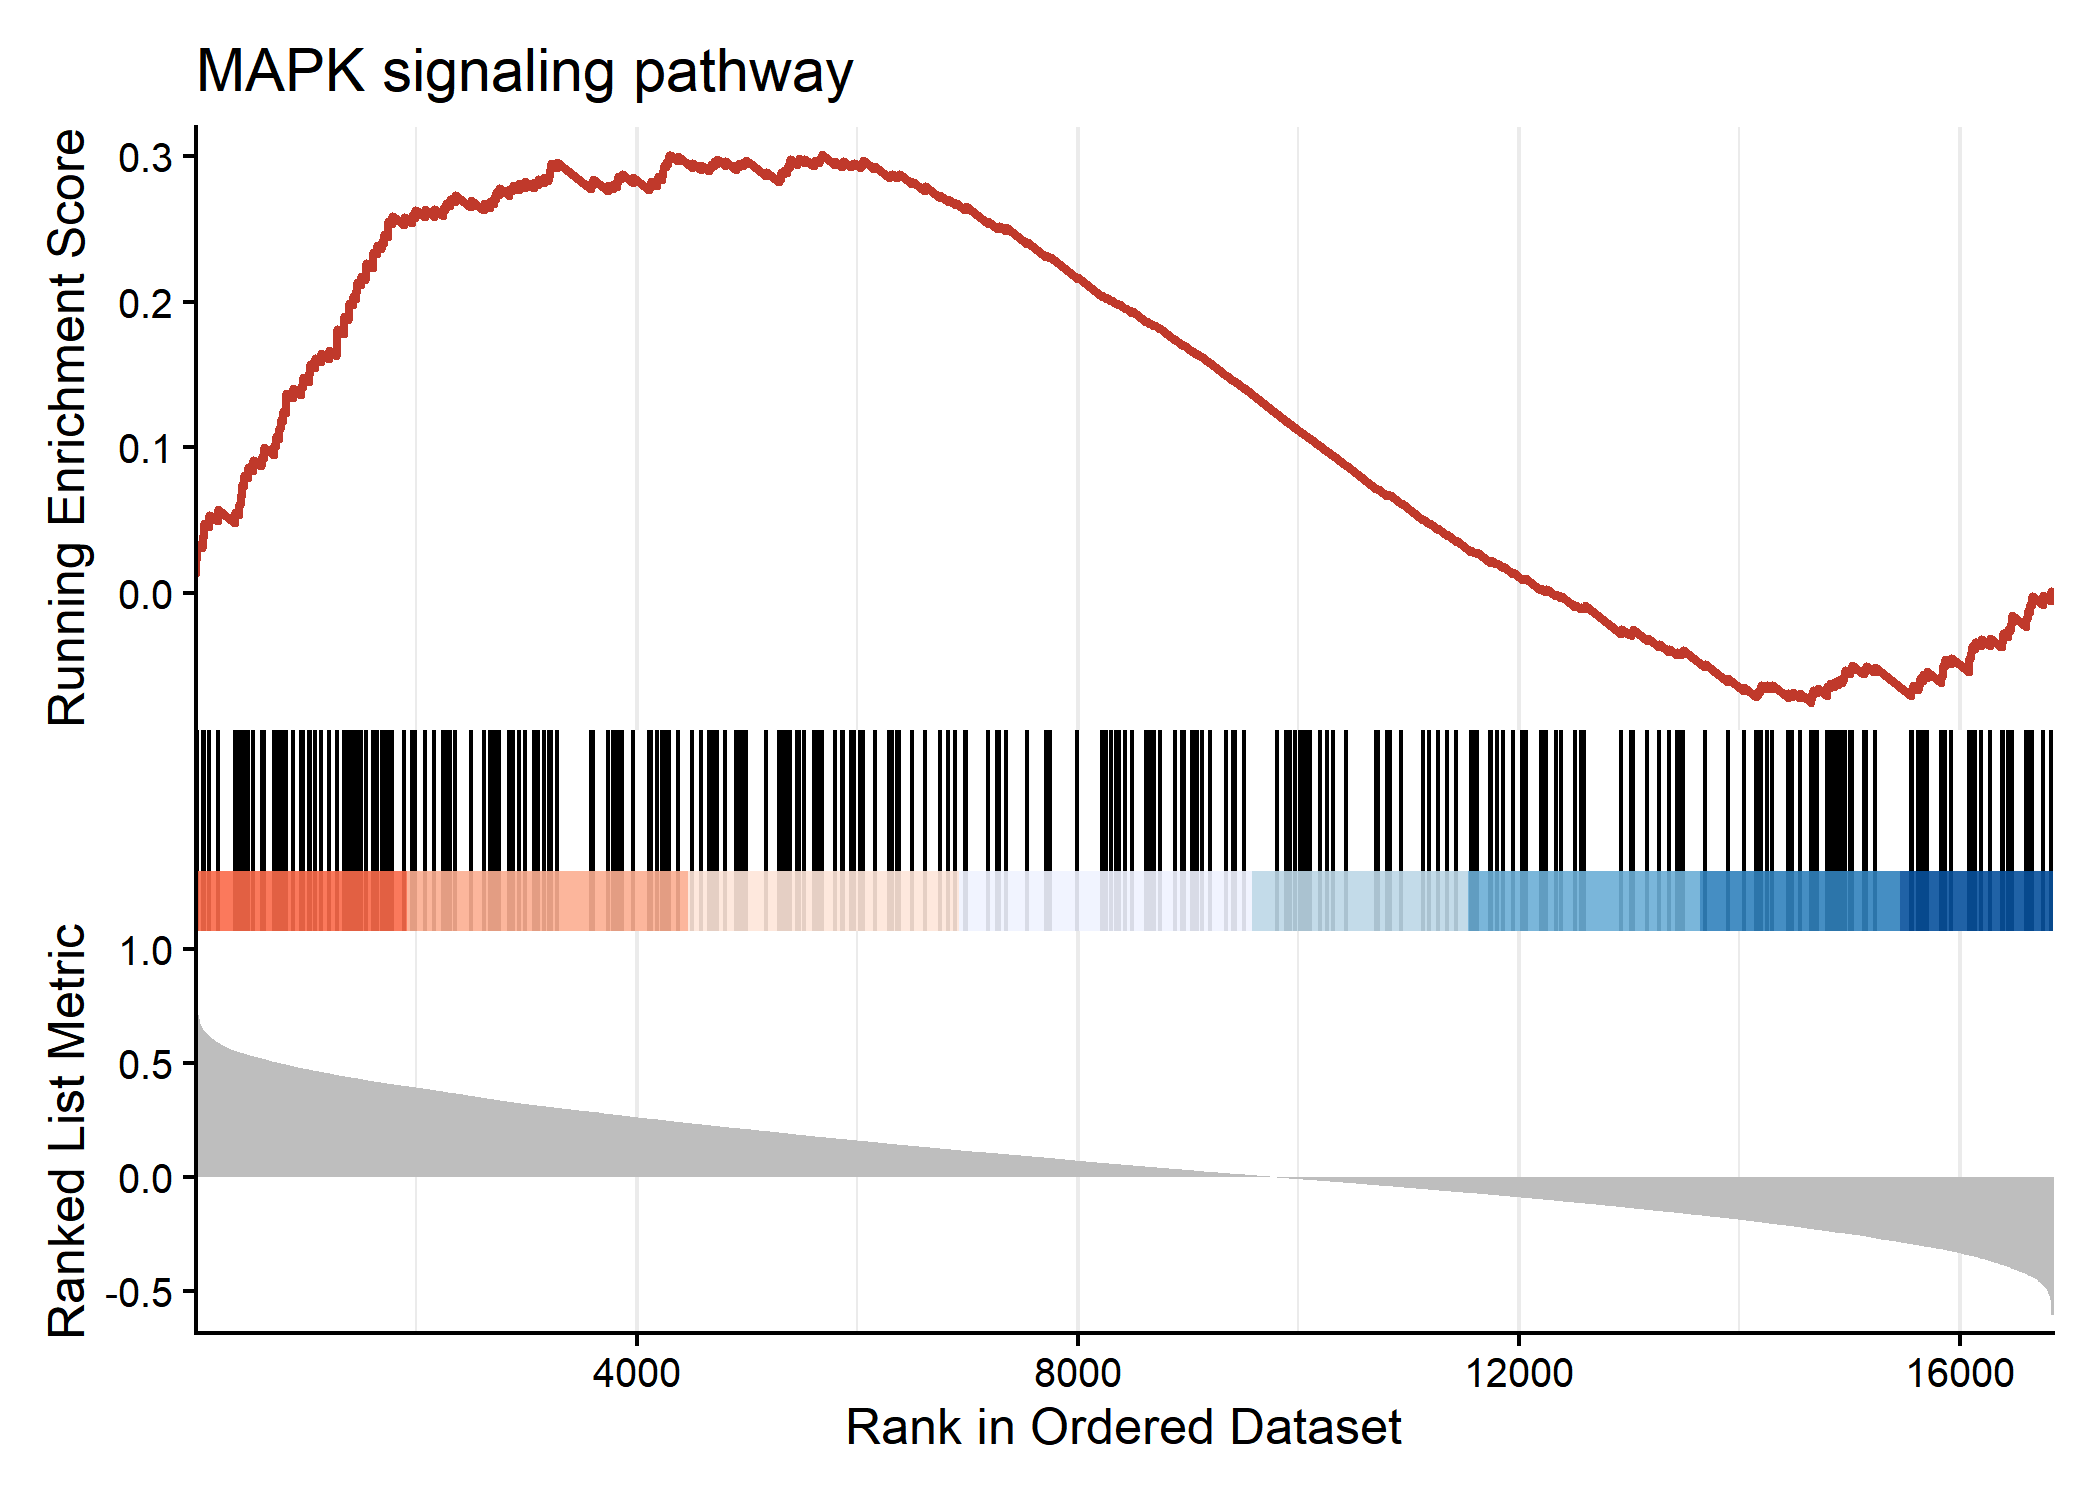
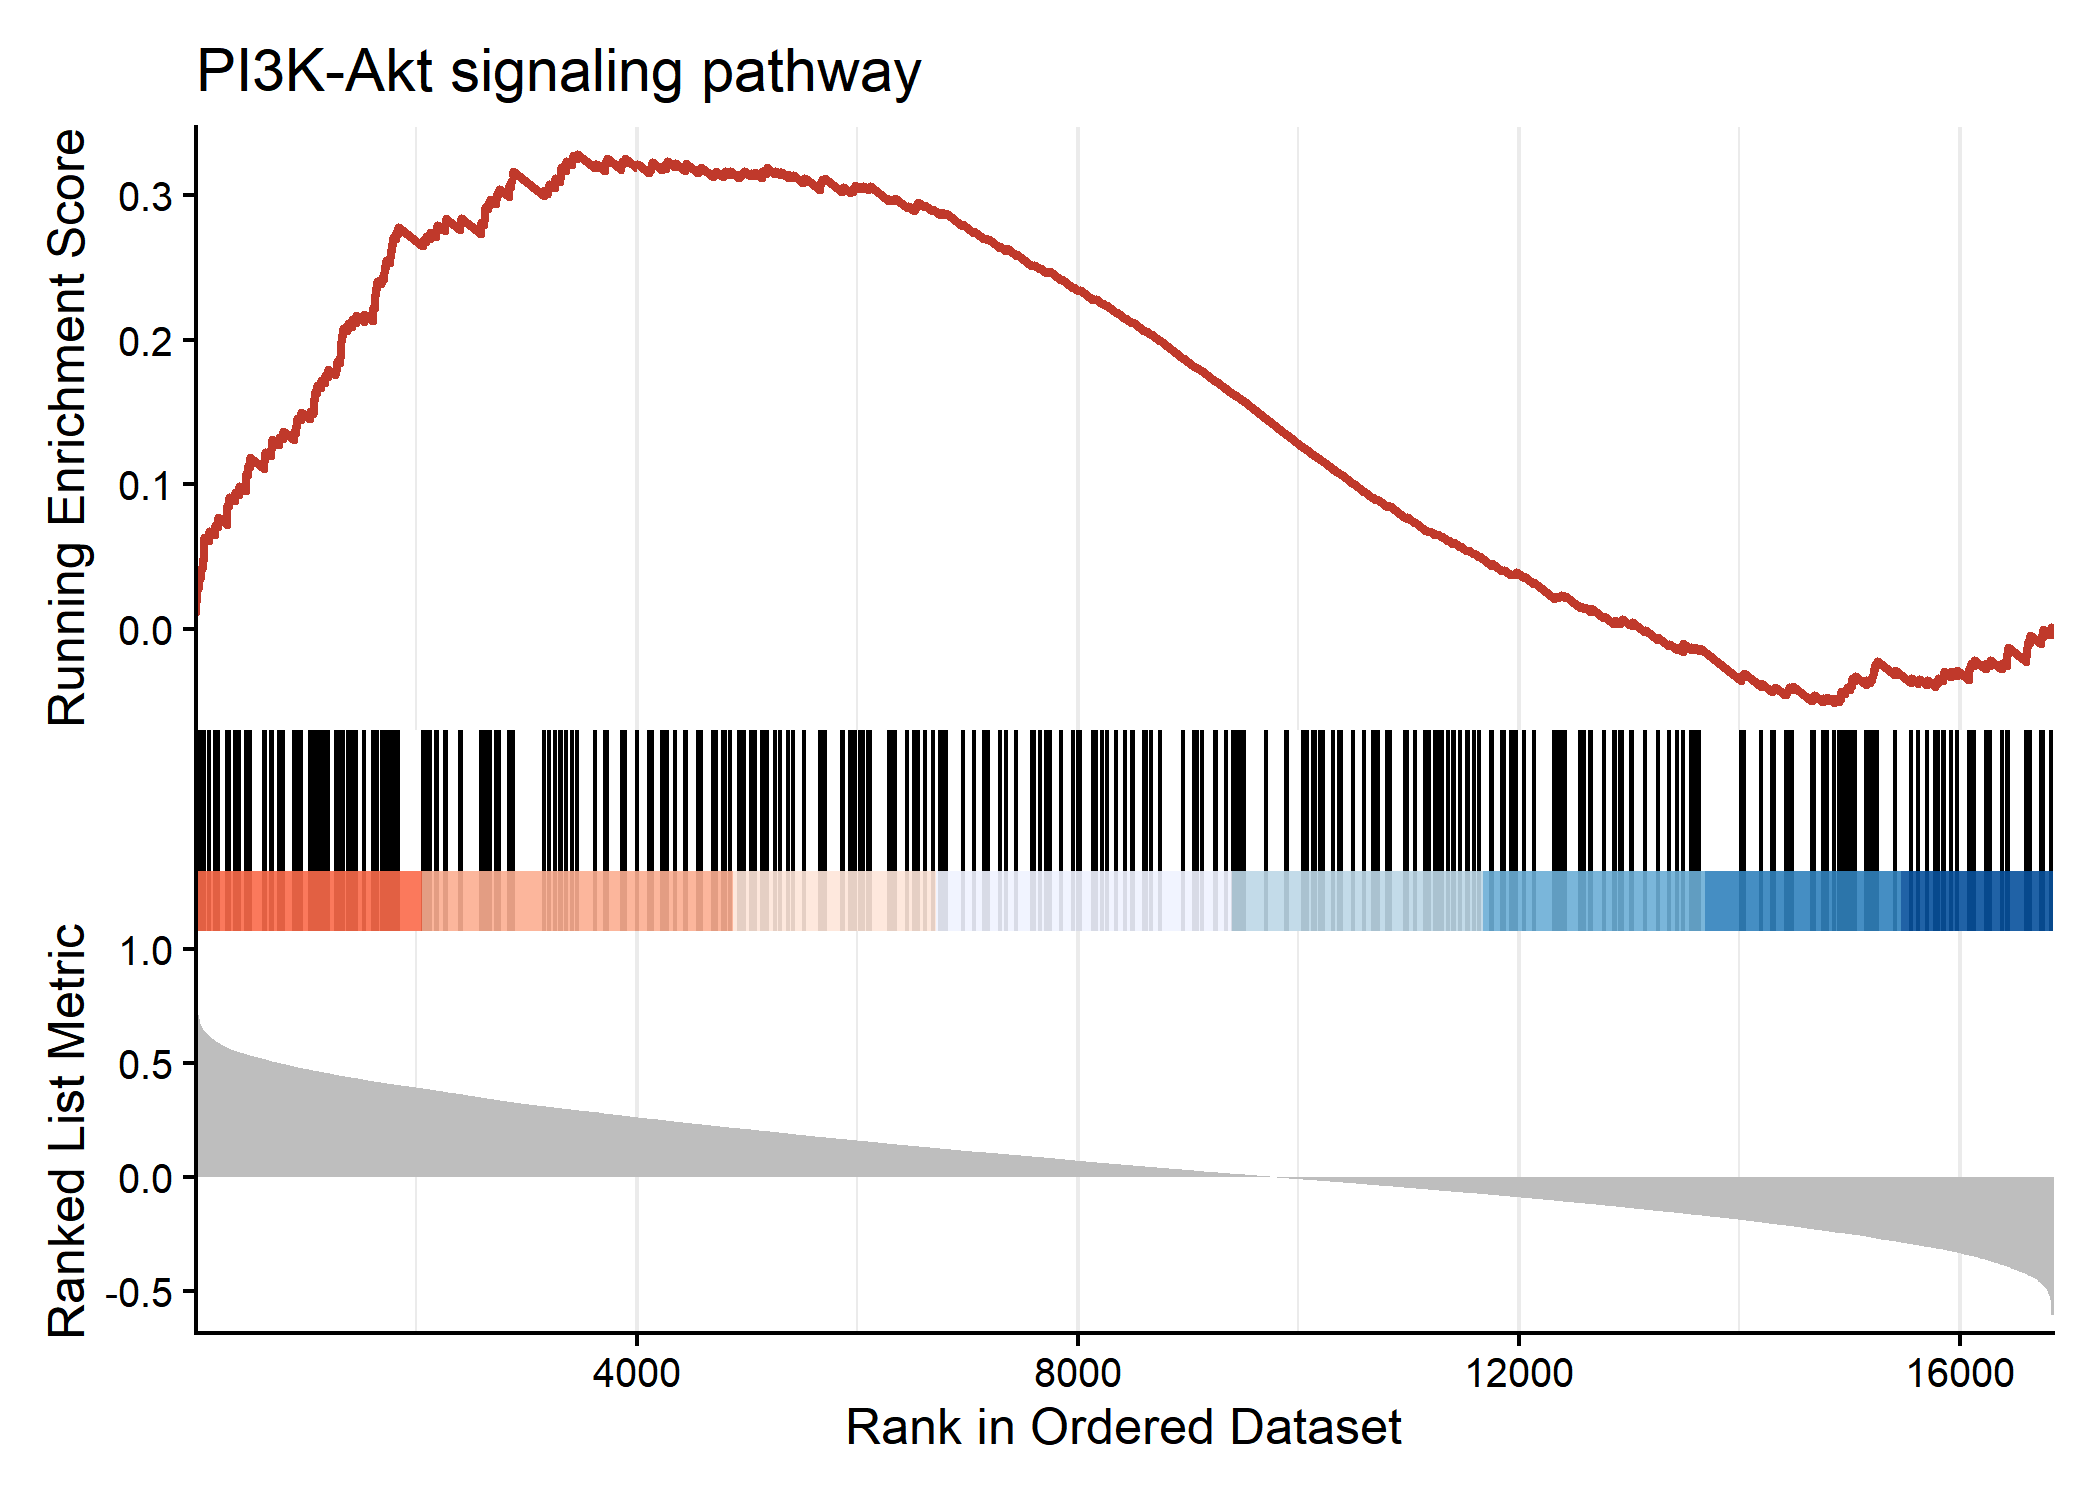
Inside that pattern, the two pathways this project actually set out to check MAPK and PI3K-Akt, the shared downstream architecture between TrkA and TrkB — both showed a clear early positive enrichment peak (NES = 1.25–1.37), though both landed in the lower half of all 183 tested pathways by effect size.
What This Does and Doesn’t Show
Shows: NTRK1 and NTRK2 are both expressed in PDAC tumors, are co-expressed beyond what tumor purity alone explains, and the shared TrkA/TrkB downstream cascade shows a directionally consistent enrichment signal tied to NTRK2 expression.
Doesn’t show: whether psilocybin, or TrkB activation of any kind, has any effect, protective or harmful, on perineural invasion or PDAC outcomes in a real patient. Bulk RNA-seq can’t separate tumor-intrinsic signaling from the neural, stromal, and immune content sitting inside the same biopsy, and that’s precisely the resolution problem an organoid-based neuro-tumor chip model, the next proposed step,is built to solve.