Alzheimer’s Disease ML Classifier
Alzheimer's Disease Machine Learning Classifier
The Question
Alzheimer’s disease affects over 55 million people globally, a number projected to reach 139 million by 2050. There is still no disease-modifying treatment. Most of what we know about why neurons fail comes from studying individual genes in isolation, but disease doesn’t happen gene by gene, it happens in networks.
So I set out to answer a narrower, more testable question: if you look at gene expression as a network rather than a list, do the genes that rise to the top as structurally important also turn out to be the genes with real biological relevance to Alzheimer’s, and can that signature be used to predict disease status at all?
This project is the answer, built in three stages. Find the genes that are dysregulated, map how they interact, and test whether that pattern can classify disease vs. healthy tissue computationally.
The Dataset
| Parameter | Details |
|---|---|
| GEO Accession | GSE5281 |
| Platform | Affymetrix Human Genome U133 Plus 2.0 Array (GPL570) |
| Comparison | Alzheimer’s Disease vs. Healthy Controls |
| Total Samples | 161 (100 AD, 61 Control) |
| Source | NCBI Gene Expression Omnibus (GEO) |
The Pipeline
Transcriptomics
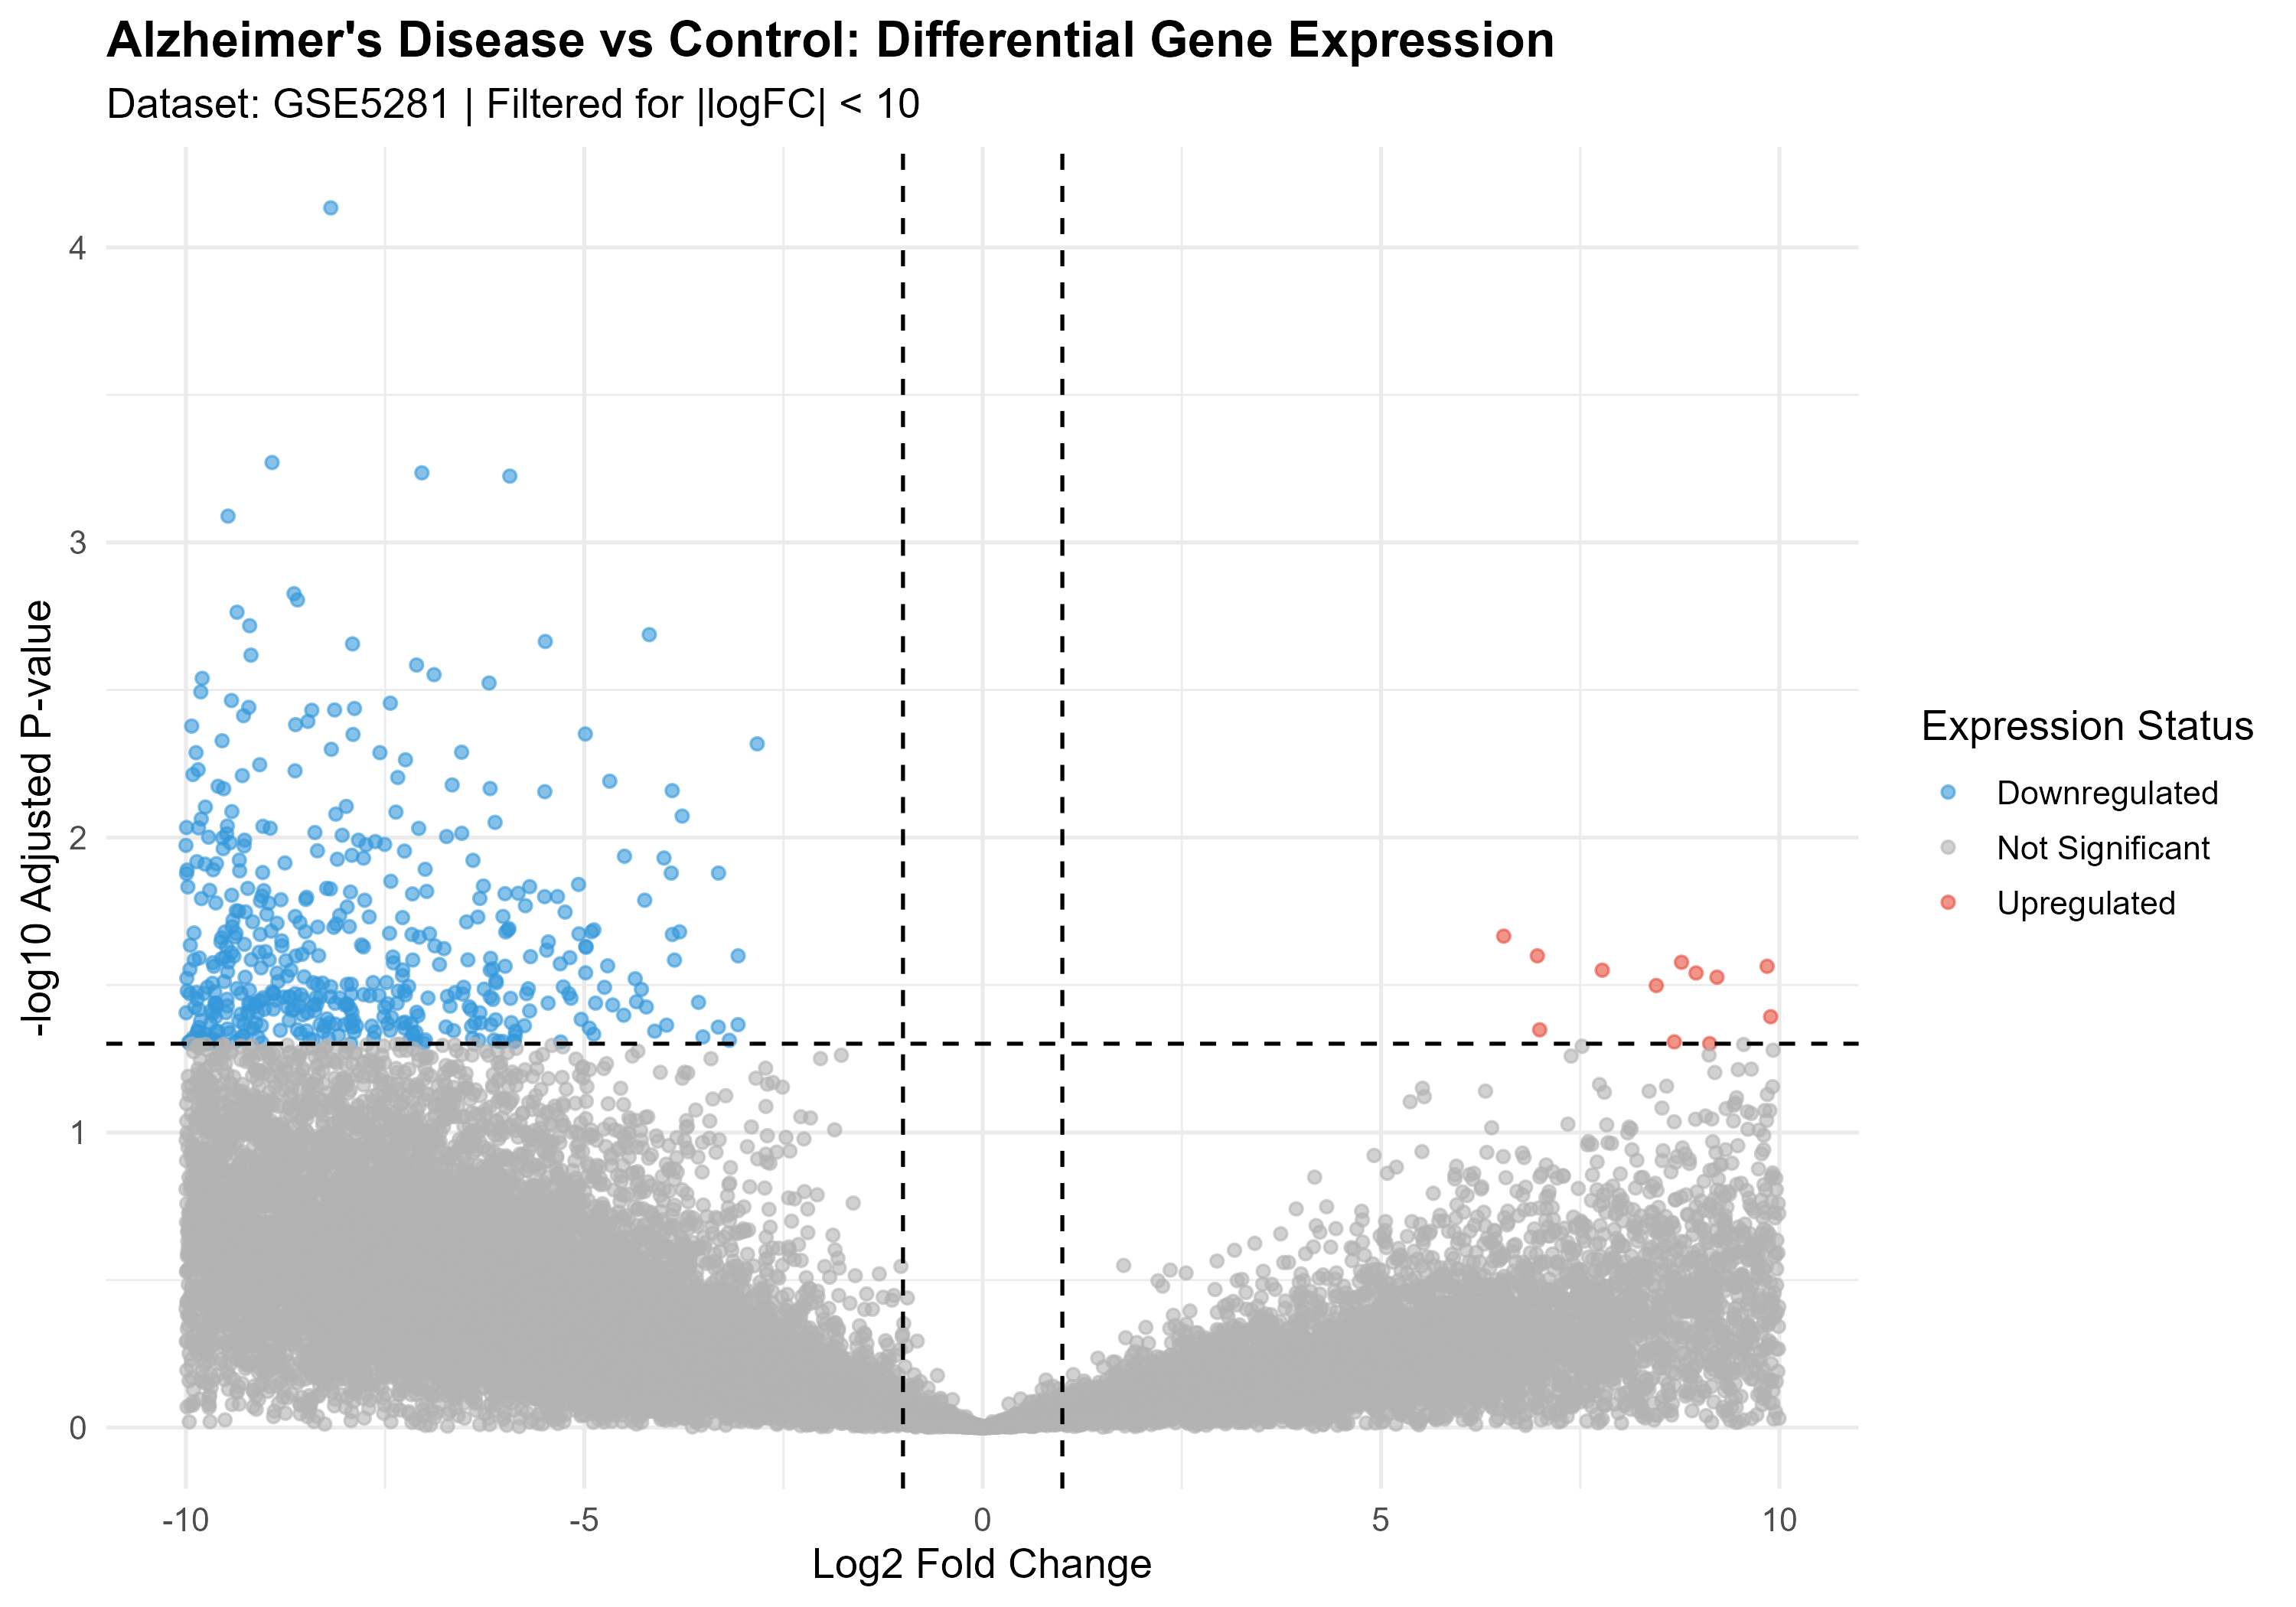
Using limma on the GSE5281 expression matrix, I compared AD and control samples and applied FDR correction to control for the thousands of genes tested at once.
Network Analysis
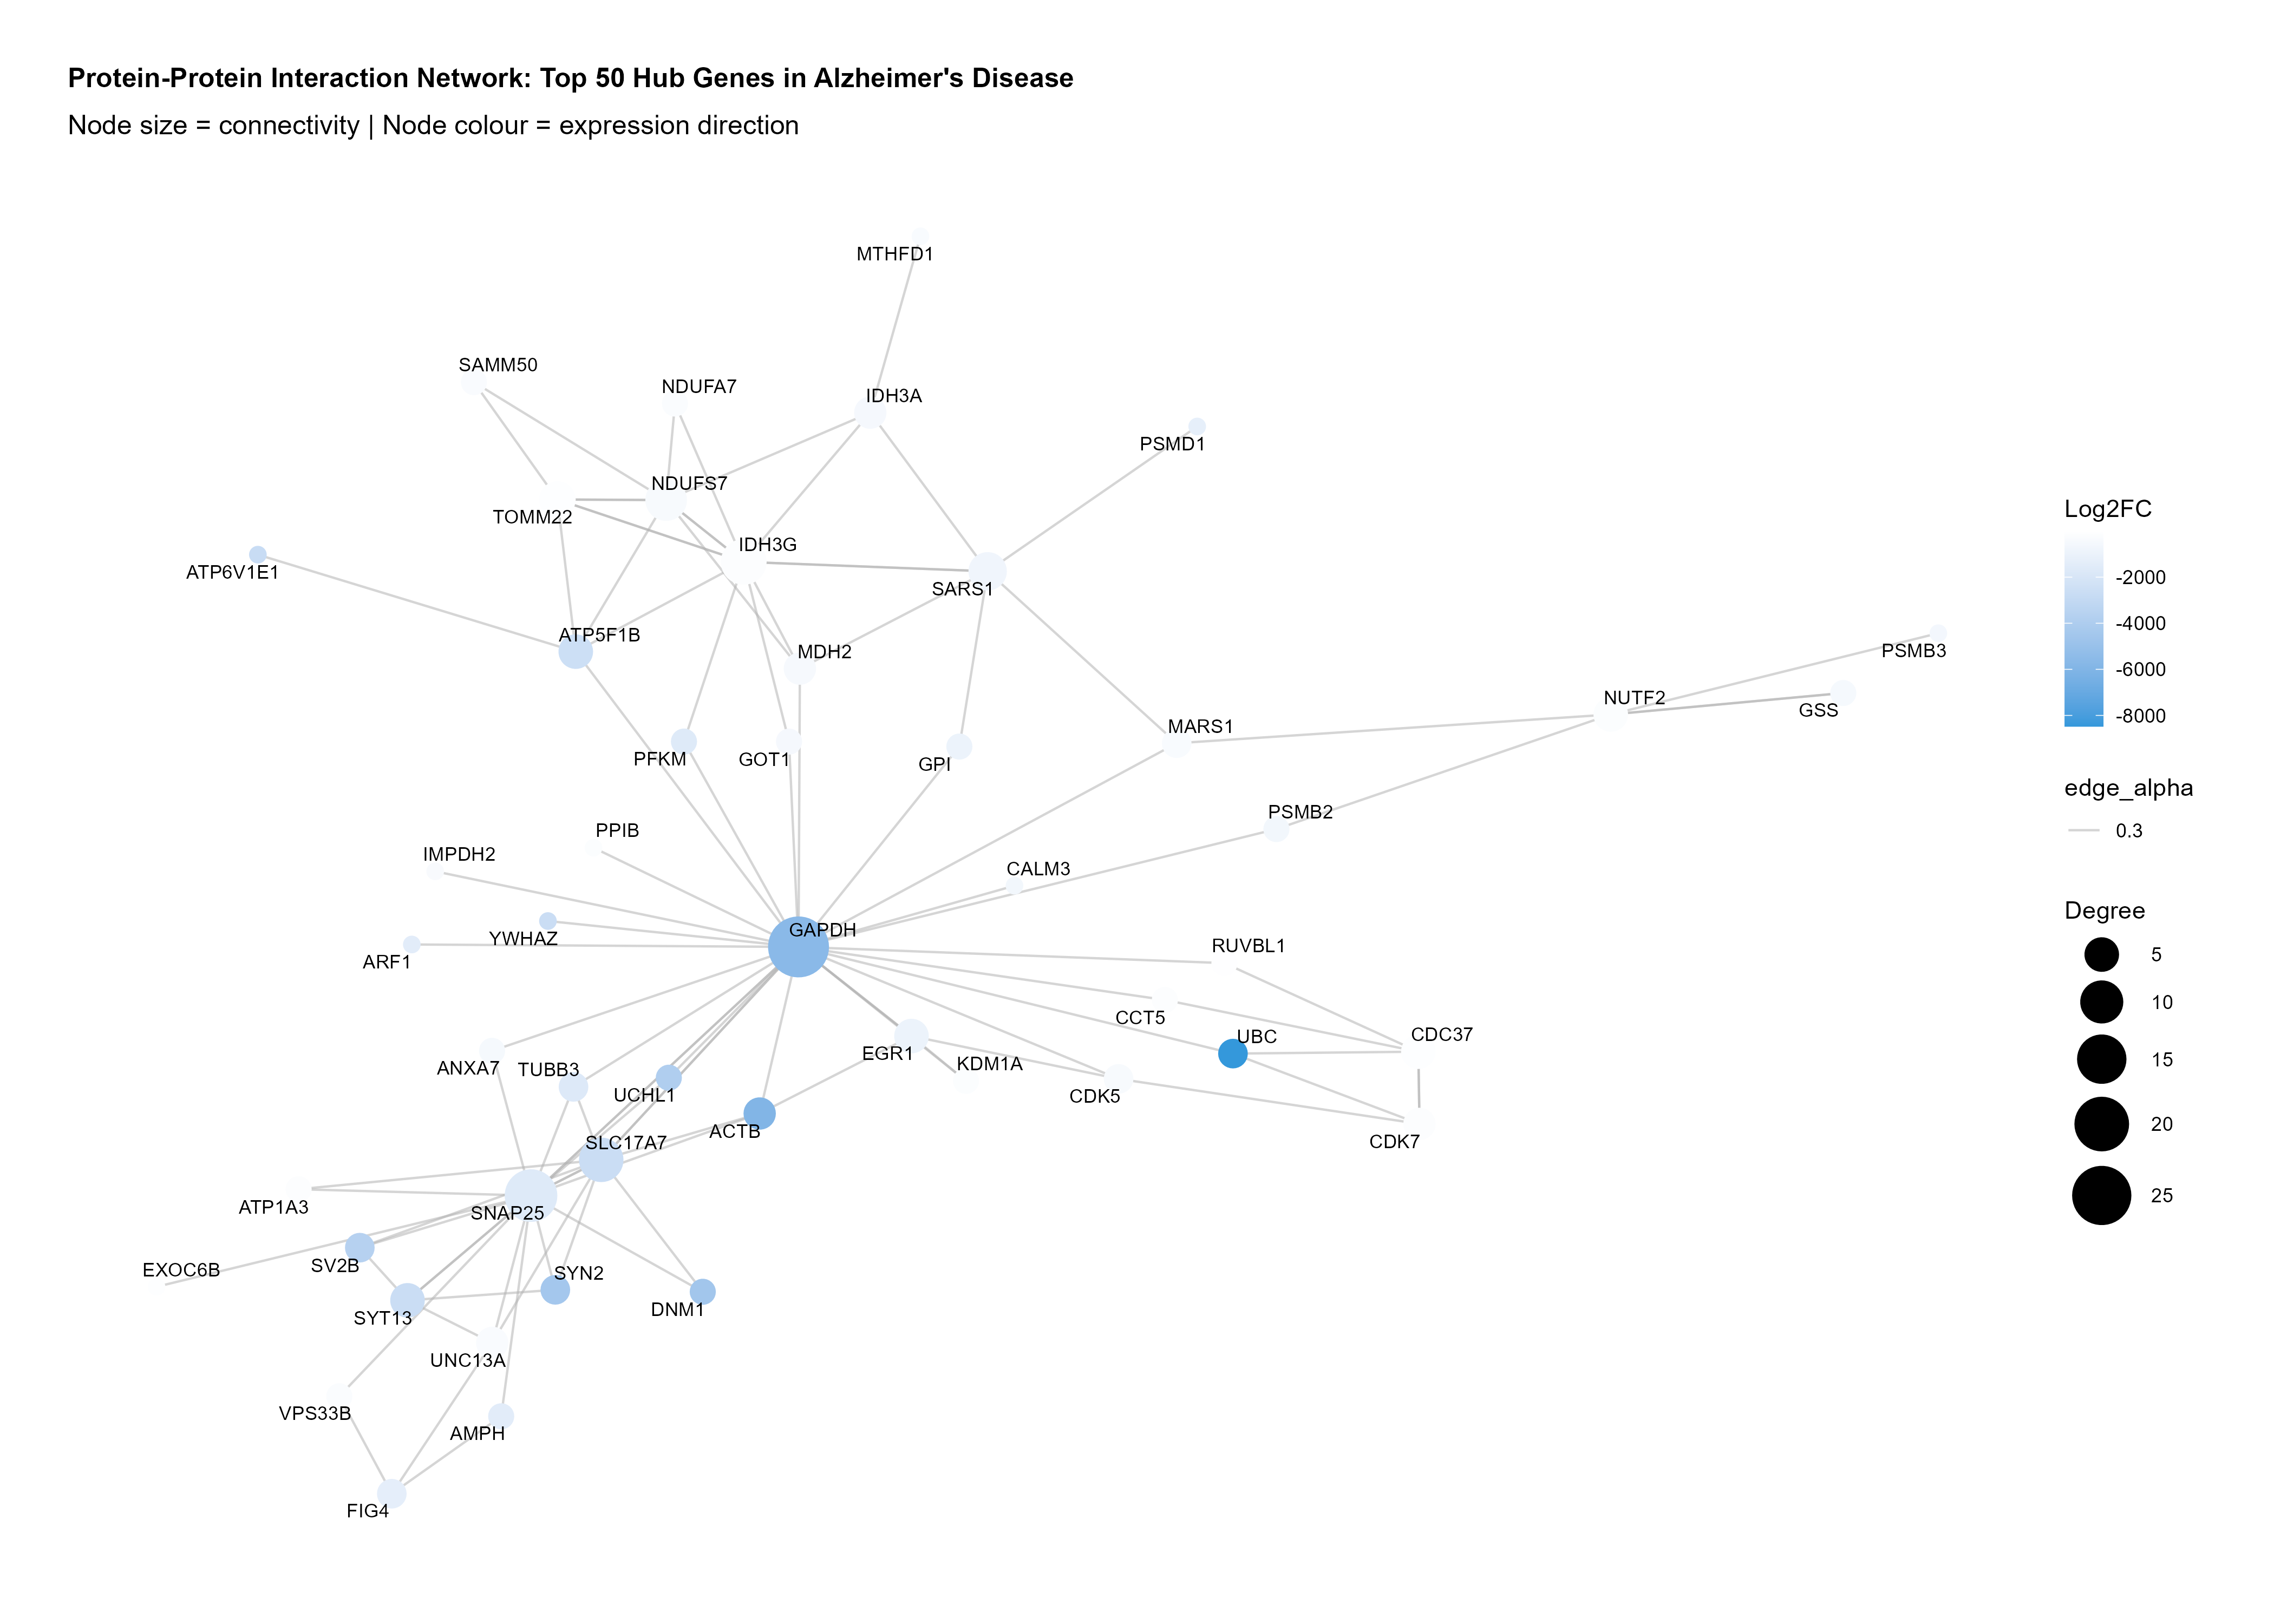
A gene being “significant” in a differential expression test tells you it changed. I built a protein-protein interaction network from the significant DEGs using STRINGdb, then ran centrality analysis in igraph to rank genes by how connected, and therefore how structurally important, they are within that network.
Twenty genes emerged as hubs. The one at the very top wasn’t a surprise: ACTB, beta-actin, the structural backbone of the cytoskeleton, which tracks with the widespread structural breakdown seen in dying neurons. But looking further down the list is where the pipeline started to say something more specific than “cells are stressed.”
| Rank | Gene | Biological Role |
|---|---|---|
| 1 | ACTB | Beta-actin — cytoskeletal integrity, neuronal structure |
| 2 | NDUFS7 | Mitochondrial complex I — energy metabolism |
| 3 | IDH3G | Isocitrate dehydrogenase — TCA cycle |
| 4 | CDK7 | Cyclin-dependent kinase — cell cycle regulation |
| 5 | SARS1 | Seryl-tRNA synthetase — protein synthesis |
| 6 | MDH2 | Malate dehydrogenase — metabolic regulation |
| 7 | CDK5 | Neuronal kinase — tau phosphorylation in AD pathology |
Three of the top seven (NDUFS7, IDH3G, MDH2), are mitochondrial and metabolic genes, lining up with a growing body of evidence that bioenergetic failure is an early, targetable event in Alzheimer’s rather than a late side effect. And then there’s #7.
The result the algorithm wasn’t told to find
The network analysis has no knowledge of Alzheimer’s biology built into it — it’s pure graph arithmetic, ranking genes by how connected they are. It doesn’t know what CDK5 does.
And it surfaced CDK5 anyway: a kinase with an established, specific role in the abnormal phosphorylation of tau, one of the two defining pathological hallmarks of Alzheimer’s disease alongside amyloid plaques.
That’s the result that matters. An unsupervised, purely topological method — one that never saw a research paper on tau pathology — converged on a gene decades of wet-lab work had already implicated in the disease. Nobody told the network where to look. It found the right neighborhood on its own.
Stage 3 Machine Learning
The final question: if you strip everything down to just the expression levels of these 20 hub genes, is that enough to tell an Alzheimer’s sample from a healthy one? I trained four classifiers on 128 samples and tested on 33 held-out samples.
| Model | CV Accuracy |
|---|---|
| Random Forest | 0.907 |
| Support Vector Machine | 0.895 |
| Logistic Regression | 0.889 |
| Gradient Boosting | 0.863 |
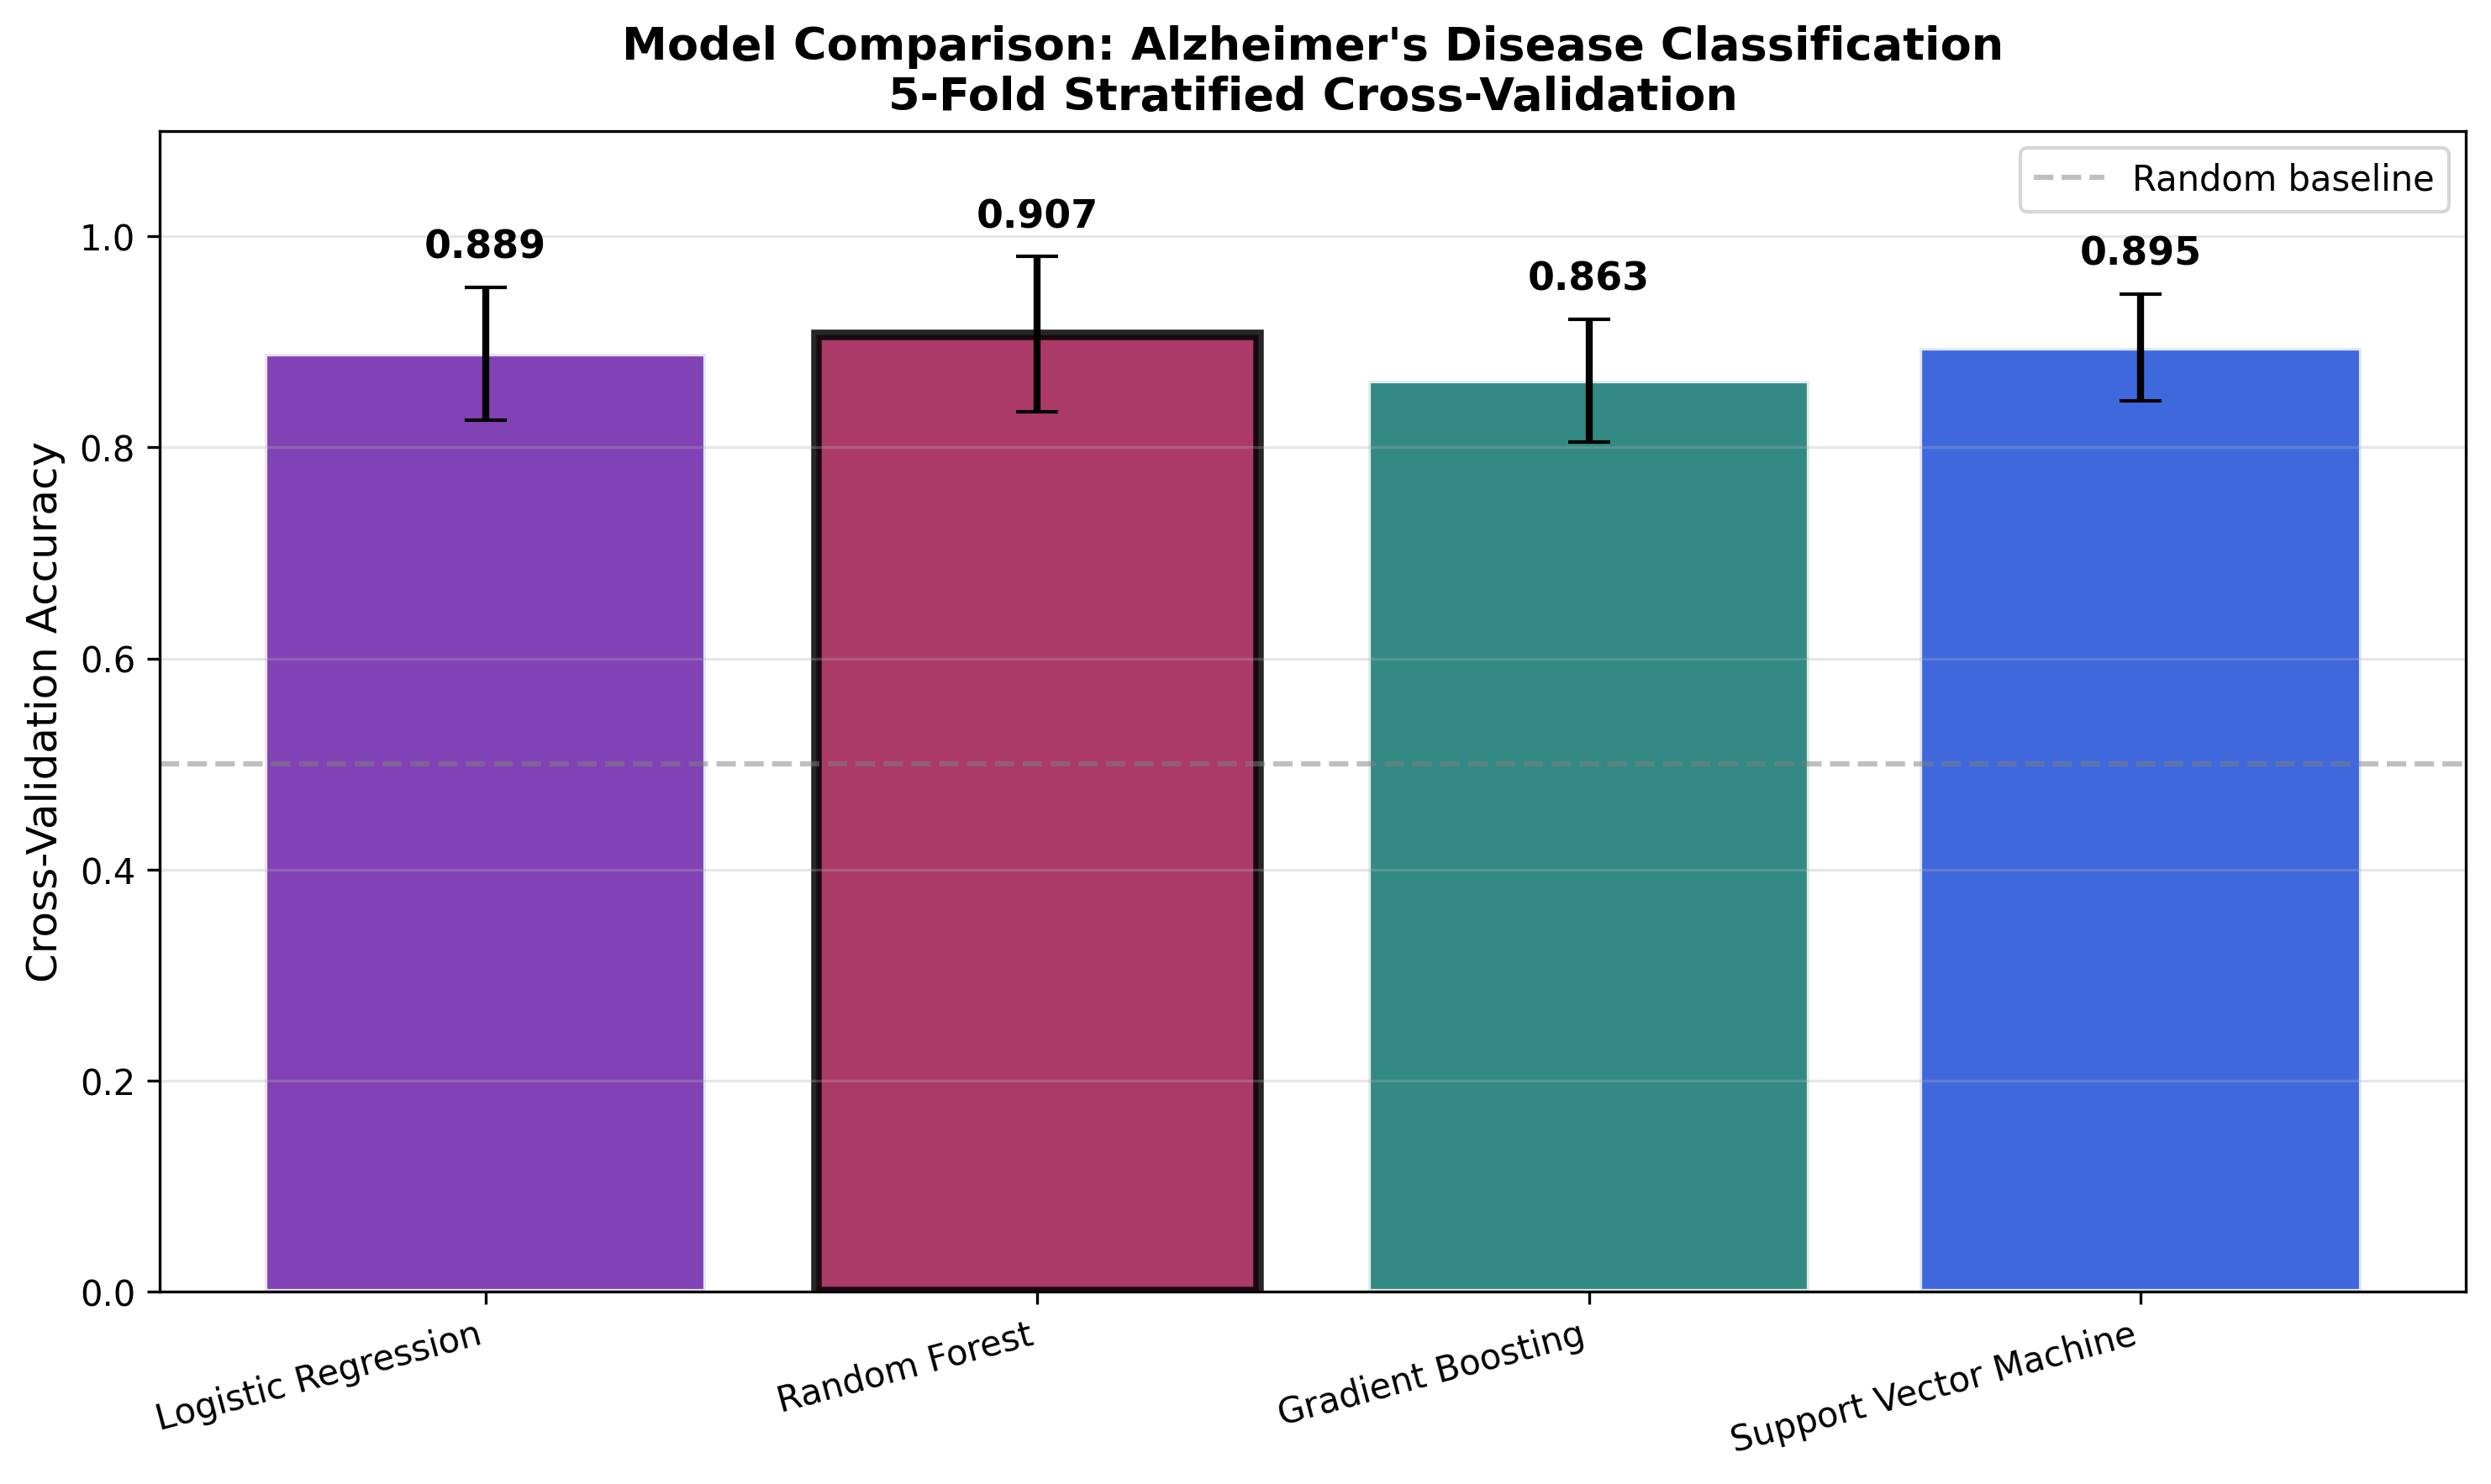
Random Forest came out on top: 90.7% cross-validation accuracy, 87.88% on the held-out test set, and a ROC AUC of 0.9038. Just as important as the accuracy number is what the model considered important — feature importance tracked closely with network centrality, meaning the genes that mattered most for prediction were largely the same genes that mattered most structurally. Two independent analyses, network topology and predictive modeling, pointed at the same short list of genes.
What This Means
This pipeline does three things: finds the genes that actually change in Alzheimer’s tissue, uses network structure — not prior assumptions — to rank which of those genes matter most, and shows that shortlist is predictive enough to classify disease from expression data alone at over 90% accuracy. When that shortlist independently rediscovers a gene with a known mechanistic role in tau pathology, that’s the pipeline validating itself against real biology, not just against its own metrics.
Scope and next steps
- The causal role of any hub gene here needs wet-lab follow-up — true of any expression study, not a gap specific to this one.
- The data is microarray (GPL570); running the same pipeline on RNA-seq is the natural extension.
- The held-out test set is 33 samples from a single cohort — the next validation step is a second GEO dataset run through the pipeline unchanged.
- Hub genes are prioritized candidates, not confirmed drug targets — which is exactly what this kind of method is for: narrowing ~20,000 genes down to a short list worth someone’s bench time.
Tools: R (limma, STRINGdb, igraph) · Python (scikit-learn, pandas, numpy) · NCBI GEO (GSE5281)